️ &
️ &  Very, Very Frightening; we-go; CARROT AR Wx
2023 was a terrible weather year and 2024 has already been a doozy in terms of chaotic weather events. So, we’ll take another opportunity, today, to peek at some weather info and utilities.
Subscribe
TL;DR
This is an AI-generated summary of today’s content.
Perplexity failed to include the links, again.
Today’s edition discusses weather-related topics and utilities. Here is a concise summary of the main sections:
- AEM 2023 United States Lightning Report: The report highlights the increase in lightning activity across the U.S. in 2023, with more than 92 million lightning flashes. It also discusses rare lightning activity in Alaska and the potential for Arctic lightning to double by the end of the century.
- Thundersnow in California: This rare phenomenon occurred when a cold air front collided with a moist atmospheric river from the Pacific, resulting in higher snowfall.
- Weather Utilities: The blog post introduces two weather utilities, We-go and CARROT AR Wx. We-go is a Go-based terminal weather client that provides a convenient way to access weather forecasts directly from the command line. CARROT is a weather app with an augmented reality (AR) mode that offers a more immersive weather experience.
️ & Very, Very Frightening
The AEM 2023 United States Lightning Report contains some interesting notes about the lightning (and, thunder) activity across the U.S. in 2023. The report first shows that the U.S. experienced well over 92 million lightning flashes that year, which represents an increase of 6.6% over the prior year.
An unexpected (for me) finding in the report is the rare lightning activity in Alaska. AEM’s “Earth Networks Total Lightning Network” (ENTLN) recorded 23,616 lightning pulses, which comprised 16,505 flashes. This lightning activity was unusual for Alaska, as it ranks last among all U.S. states for lightning density and is in the bottom 10 for its total lightning count, despite being the largest state in terms of land area.
The lightning activity from a single 24-hour period accounted for about 31% of the state’s entire lightning activity for the year. AEM’s researchers predict that Arctic lightning could double by the end of the century. This increase in lightning activity led to about 30 new fires across Alaska, causing the total burned area to increase from 2,000 acres on July 20 to more than 290,000 acres by the end of the month.
Another notable event highlighted in the report is the thundersnow in California. This rare phenomenon occurred when a cold air front dropping down along the California coastline was projected to collide with the moist atmospheric river from the Pacific. The atmospheric instability that gives rise to thundersnow also tends to result in higher snowfall, which is precisely what was observed in this case.
As the climate warms, events like the lightning storm in Alaska may become less exceptional. This means risk managers across the U.S. are going to need to prepare for and manage the risks associated with increased lightning activity.
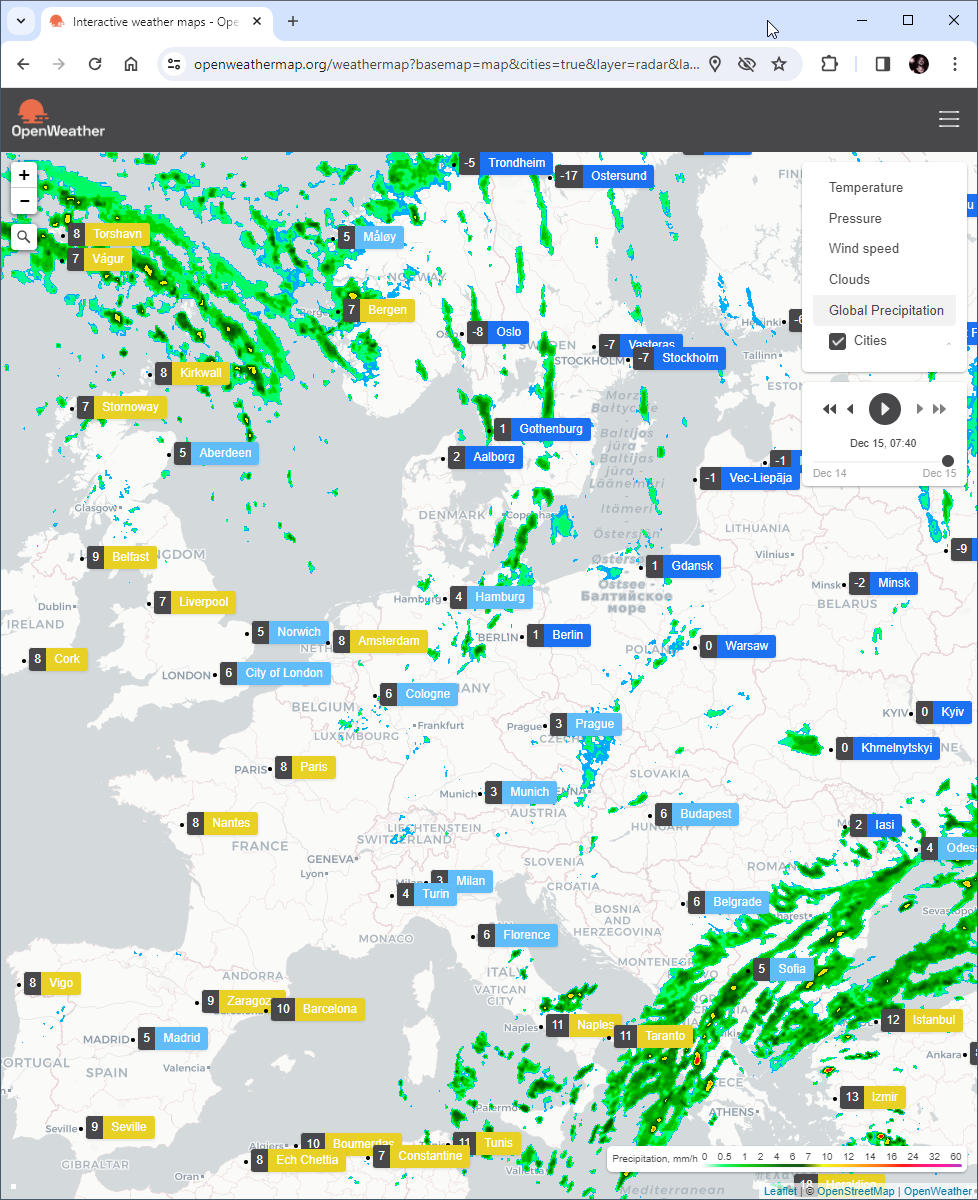
There’s quite a bit of data buried in JavaScript containers in the site. I found the map data pretty intriguing (one of the maps is in the section header), and hacked together a bit of R to yank them out. That code is below, and the data is on my main site.
library(V8)library(janitor)library(rvest)library(stringi)# Read in the AEM site URL (the `?…` bit seems to be necessary)pg <- read_html("https://aem.eco/2023-united-states-lightning-report/?_hsmi=289823499")# Find all the mapshtml_nodes(pg, xpath = ".//script[contains(@src, 'Map.js')]") |> html_attr("src") -> aem_map_urls# Snakecase f_t_waem_map_urls |> stri_replace_last_regex( pattern = "\\.js\\?.*$", replacement = "" ) |> basename() |> make_clean_names() -> aem_map_names# Read in all the maps JSaem_map_urls |> lapply(readLines) |> setNames(aem_map_names) -> aem_js_maps# Start a new JS contextctx <- v8()names(aem_js_maps) |> sapply(\(.map) { # Find the "data:" start line and the closing JS array lines start <- which(stri_detect_fixed(aem_js_maps[[.map]], "data:")) end <- tail(which(stri_detect_fixed(aem_js_maps[[.map]], "],")), 2)[1] # Clean them up so we can eval them aem_js_maps[[.map]][start] <- stri_replace_first_fixed(aem_js_maps[[.map]][start], "data:", sprintf("const %s =", .map)) aem_js_maps[[.map]][end] <- stri_replace_last_fixed(aem_js_maps[[.map]][end], ",", "") # Eval the JS in the context we made ctx$eval(aem_js_maps[[.map]][start:end]) # Retrieve the value ctx$get(.map) }) |> jsonlite::toJSON() |> writeLines("aem-maps.json") we-go
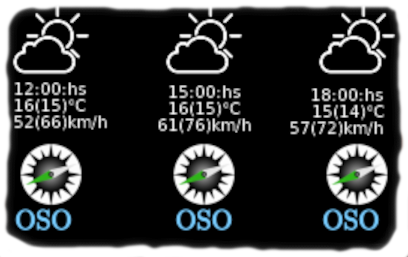
We-go (a.k.a., wego), is a golang weather client for the terminal written in. It provides a convenient, “no-frills” way to access weather forecasts directly from the command line. You can see the forecast for 1-7 days and configure preferred units.
It supports multiple “backend” weather sources (caiyunapp.com, openweathermap, smhi, worldweatheronline), including the ability to provide your own JSON source.
Output options include an ASCII art table, emoji, JSON, or markdown.
While it is “yet-another” CLI weather client, this one seems super flexible and hackable. The source is very grokable and you may enjoy a challenge to add an interface to Apple’s WeatherKit (I may try that, too).
The first run generates a config file that you can edit to adjust the default behavior.
CARROT AR Wx
I  CARROT enough to give it a prominent spot on my Apple device screens and use it daily.
My weather info needs are focused on data values, so I only recently discovered CARROT’s augmented reality (AR) mode. It’s more kitschy than useful, but it’s kind of fun being berated (and informed) on-device and in virtual meatspace.
It’s worth the coin for a subscription, and you can see a snap of the AR mode in the section header.
Subscribe
FIN
Remember, you can follow and interact with the full text of The Daily Drop’s free posts on Mastodon via @dailydrop.hrbrmstr.dev@dailydrop.hrbrmstr.dev 
https://dailydrop.hrbrmstr.dev/2024/01/24/drop-407-2024-01-24-talk-about-the-weather/


 )))
))) 


 ¿Qué significan `"current"`, `"cnt01"`, `"cnt02"`, `"cnt03"` en el script?


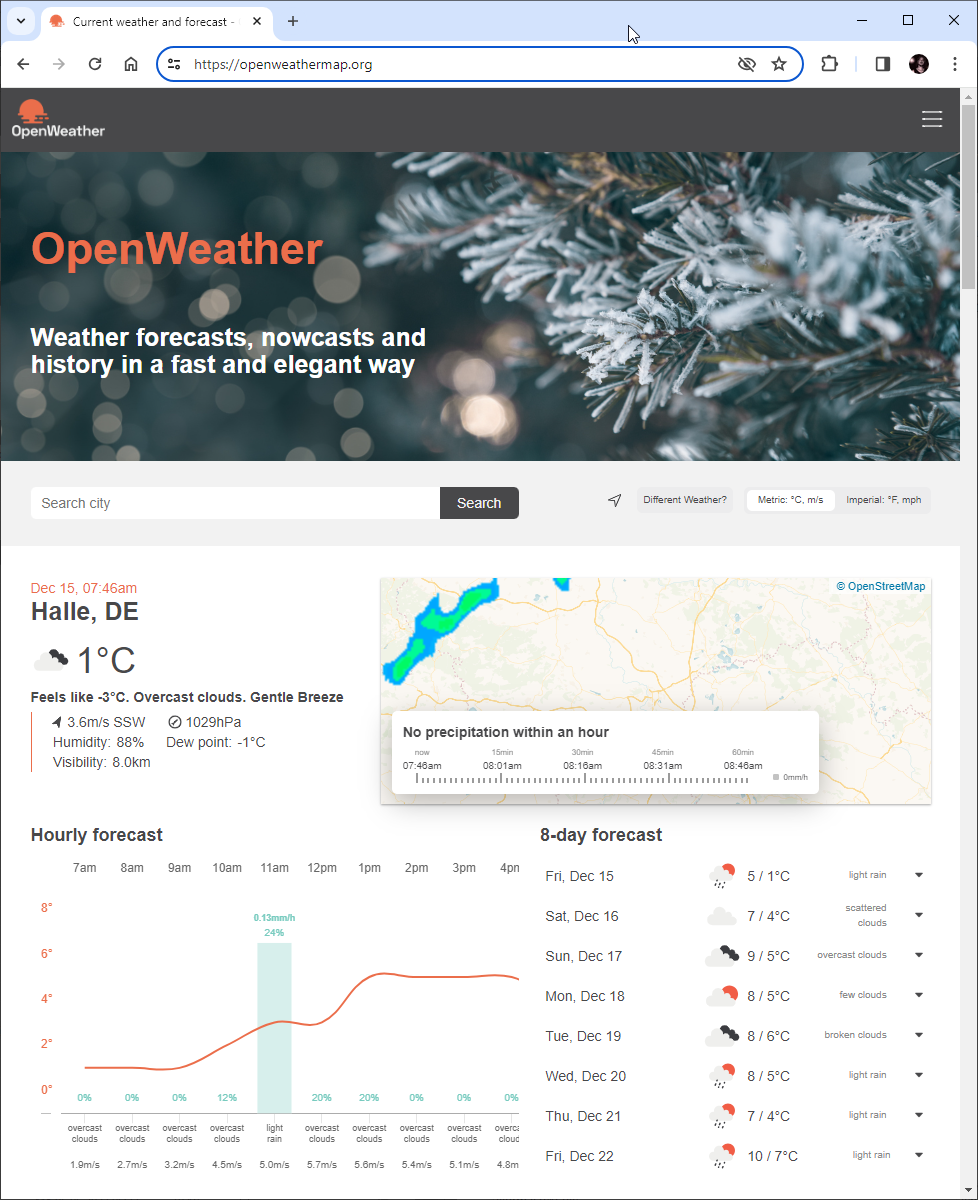
 OpenWeatherMap entrega pronósticos en intervalos de 3 horas: